



















How Simhastha 2028 Crowd Density Is Calculated Hour by Hour
Learn how Simhastha 2028 calculates crowd density hour by hour using real-time data, AI prediction, and movement tracking for safe pilgrim flow.

How Simhastha 2028 Crowd Density Is Calculated Hour by Hour
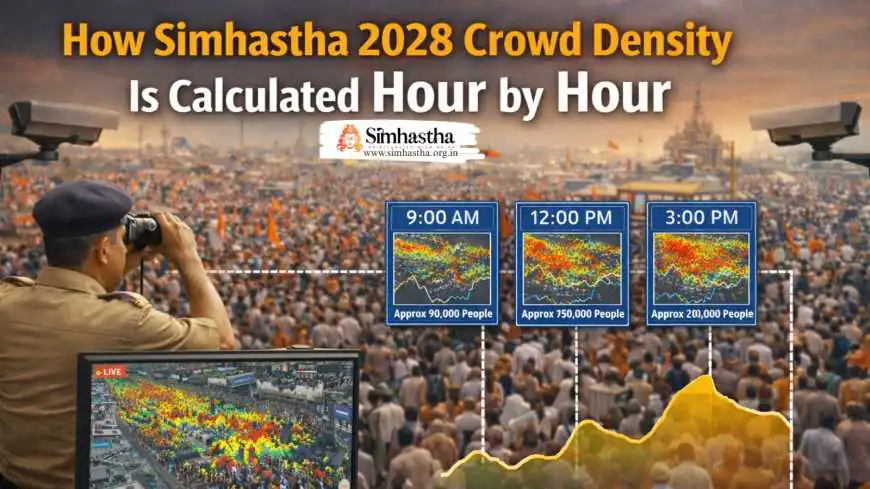
Simhastha 2028 is engineered as a continuously evolving system where every hour is measured, analyzed, and optimized. Crowd density is not estimated once but recalculated repeatedly using real-time data streams, predictive algorithms, and behavioral models. Authorities monitor how many people are present, how quickly they are moving, and how density changes across zones throughout the day. This hour-by-hour calculation enables proactive crowd control, prevents dangerous congestion, and ensures that millions of pilgrims can move safely through Ujjain’s sacred landscape without disruption.
For Every pilgrims, understanding Simhastha 2028 dates and the official Shahi Snan timeline is essential before booking flights or accommodation, as these sacred dates are completely non-negotiable
What Crowd Density Means in Simhastha Planning
At its core, Simhastha 2028 crowd density refers to the number of individuals occupying a defined area at a specific time.
However, in real-world application, it goes far beyond a simple number. It represents:
Trending Guides Now
Why Simhastha Happens Only When Jupiter Enters Leo ?

Simhastha Kumbh Mela Explained for First-Time Visitors
How Simhastha 2028 Traffic Control Relies on Ring Roads and Bypass Corridors

How Local Businesses Are Preparing for Simhastha 2028

Ujjain Railway Station to Mahakaleshwar Temple Distance (2026 Guide)

Ujjain Simhastha 2028 Dates Announced: Full Shahi Snan & Event Timeline
Mahakaleshwar to Kal Bhairav Temple: Distance, Auto Fare, Travel Time and Route Options

Ujjain Simhastha 2028 Road Widening Brings Action Against Religious Structures Houses and Shops
- The pressure on physical space
- The safety level of a zone
- The efficiency of movement
In high-density gatherings like Simhastha, even small increases in density can dramatically change risk levels.
A space that feels comfortable at one moment can become critical within minutes if inflow exceeds outflow.
The Mathematical Foundation of Density Calculation
The base logic remains simple, but its application is dynamic and continuous.
\text{Density} = \frac{\text{Number of People}}{\text{Area (m^2)}}
In Simhastha, this formula is applied simultaneously across dozens of zones.
The crowd density calculation formula Kumbh is recalculated every few minutes, not just hourly, using updated inputs.
The complexity lies not in the formula itself but in accurately determining both variables in real time.
A first time Simhastha guide is essential because without contextual understanding, pilgrims arrive prepared for devotion but unprepared for logistics, stamina, patience, and adaptability.
Why Hour-by-Hour Tracking Is Essential
Simhastha operates on a dynamic timeline where crowd behavior changes continuously.
The hourly crowd monitoring Simhastha approach captures patterns such as:
- Early morning inflow of pilgrims
- Midday stabilization
- Peak surge during ritual timings
- Evening dispersal
Each hour has a distinct behavioral pattern.
Without hourly tracking, authorities would react too late to rising density levels.
Multi-Layer Data Collection Systems
Accurate density calculation depends on diverse data inputs working together.
The Kumbh crowd calculation system integrates multiple technologies to build a real-time picture.
Key sources include:

- Video analytics from CCTV cameras
- Drone-based aerial surveillance
- Mobile network signal density
- RFID and entry gate counters
Each source captures a different aspect of crowd presence, ensuring accuracy through cross-verification.
Couples arriving during Ujjain Simhastha should spend their first few hours adjusting to the rhythm of the pilgrimage. Walking slowly through the city allows visitors to absorb the powerful spiritual atmosphere created by the gathering of saints and devotees attending the Ujjain Kumbh Mela.To deepen your understanding of the spiritual customs and sacred rituals practiced during Ujjain Simhastha, read our complete Simhastha rituals and sacred practices guide that explains their meaning, timing, and significance.
AI-Based Crowd Prediction Models
Modern systems do not just measure the present. They anticipate the future.
The AI crowd prediction Simhastha model processes:
- Historical event data
- Current movement patterns
- Weather conditions
- Ritual schedules
This allows authorities to forecast density spikes before they occur.
Predictive alerts help in taking preventive actions such as route diversion or controlled entry.
Zone-Wise Density Mapping Across the City
Simhastha is divided into micro-zones for detailed monitoring.
The density mapping Simhastha system ensures that each zone is analyzed independently.
Zones include:
- River ghats
- Akhara areas
- Main corridors
- Transit points
Each zone has its own density threshold and response strategy.
Also Read | Best Time to Visit Ujjain Simhastha 2028

Real-Time Surveillance and Automated Counting
Visual data plays a critical role in density estimation.
Smart surveillance Simhastha systems use AI-powered image processing to:
- Count individuals in a frame
- Measure crowd compactness
- Detect unusual movement patterns
This eliminates manual counting errors and provides instant updates.
Movement Flow as a Key Density Indicator
Density is closely linked to movement speed.
The pilgrim flow tracking system measures how fast people are moving through a space.
When movement slows down:
- Density increases
- Risk levels rise
Flow analysis helps identify bottlenecks before they become critical.
Also Read | Step-by-Step Guide to Shipra Snan at Ujjain Kumbh Mela
Footfall Forecasting for Peak Events
Peak days require advanced planning.
The footfall prediction Kumbh system estimates:
- Expected number of pilgrims
- Arrival patterns by time
- Zone-wise distribution
This helps authorities prepare infrastructure and deploy resources in advance.
Density Thresholds and Risk Classification
Authorities define clear thresholds for safety.
The Simhastha safety planning model categorizes density into levels such as:
- Comfortable flow
- Controlled congestion
- High density
- Critical density
Each level triggers predefined responses.
This ensures consistency and speed in decision-making.
Command Centers and Real-Time Decisions
All data converges at centralized control rooms.
The Ujjain crowd analytics system allows officials to monitor:
- Multiple zones simultaneously
- Real-time density updates
- Movement patterns
Decisions are made instantly based on live data.
Integration with Traffic and Route Diversion
Crowd density directly influences route planning.
The crowd flow management system dynamically adjusts:
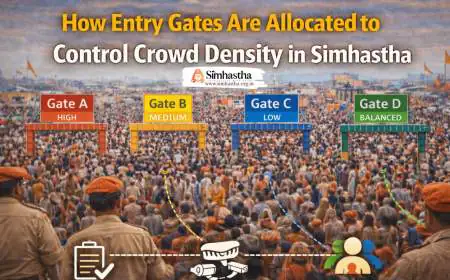
- Entry gates
- Exit routes
- Traffic diversions
If one route becomes congested, alternative pathways are activated immediately.
Human Intelligence and Ground Feedback
Technology is powerful, but field officers provide critical insights.
The real time crowd monitoring India events system combines:
- On-ground observations
- Behavioral analysis
- Immediate reporting
This human layer enhances accuracy and responsiveness.
Learning from Past Simhastha Data
Historical data plays a crucial role in refining models.
The Kumbh crowd management technology system analyzes past trends such as:
- Peak hour patterns
- High-density zones
- Movement bottlenecks
These insights improve current predictions and planning.
Emergency Response Triggered by Density Alerts
When density crosses safe limits, immediate action is taken.
The system triggers:
- Controlled entry restrictions
- Route diversions
- Deployment of emergency teams
The Simhastha safety planning framework ensures rapid execution.
Continuous Feedback Loop for Accuracy
Crowd density calculation is an ongoing process.
It operates in a loop:
- Data collection
- Analysis
- Action
- Recalculation
This loop keeps the system adaptive and responsive.
Behavioral Patterns That Influence Density
Human behavior plays a major role in density changes.
Pilgrims tend to:
- Move in groups
- Follow visible paths
- Slow down near rituals
Understanding these patterns improves crowd control analytics India models.
Role of Weather and External Factors
External conditions also impact density.
Weather changes can:
- Increase or decrease crowd movement
- Shift peak timings
The system adjusts predictions accordingly, making dynamic crowd monitoring more accurate.
Synchronizing Ritual Timings with Density Planning
Ritual schedules directly affect crowd distribution.
Authorities align Simhastha 2028 crowd density planning with:
- Shahi Snan timings
- Akhara processions
- Major religious events
This synchronization ensures smoother flow.
Infrastructure Designed Around Density Insights
Density data influences infrastructure decisions.
The Kumbh crowd calculation system helps determine:
- Route widths
- Number of entry points
- Placement of barricades
Infrastructure evolves based on real data, not assumptions.
Technology and Tradition Working Together
Simhastha is a blend of ancient faith and modern systems.
While rituals remain unchanged, their execution is supported by advanced analytics.
The AI crowd prediction Simhastha model ensures that tradition continues safely at scale.
Where Every Hour Defines Safety and Flow
Simhastha 2028 transforms crowd management into a science of time.
Every hour is measured, analyzed, and optimized to maintain balance between devotion and safety.
Crowd density is not just a number. It is a signal that guides movement, shapes decisions, and protects millions.
In this continuously evolving system, precision replaces uncertainty, and every moment becomes an opportunity to ensure that the sacred journey remains smooth, safe, and uninterrupted.
Frequently Asked Questions